'98 Camry
Rev. 6/18/2024 LRM -- Annual update
It's time for my safety inspection, so I've uploaded another year's worth of notes and data from my car log. Here are some figures with more recent data:
Comments related to figures:
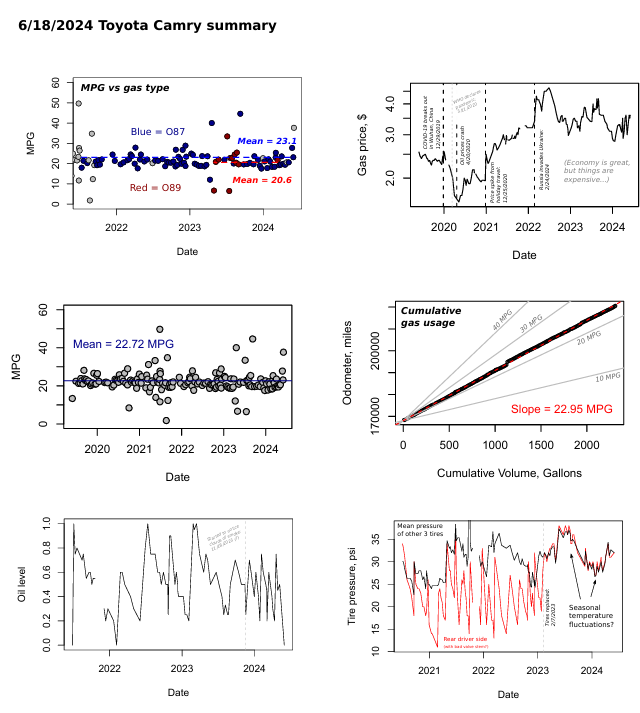
- MPG vs gas type: It turns out that my car got fewer miles per gallon on average with the O89 fuel than with the O87 fuel, but the difference in means isn't very significant (T-test: p ~ 0.3)
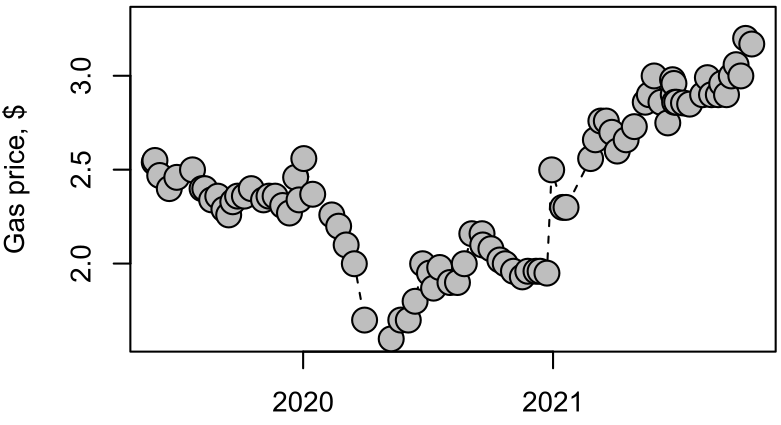
- Gas prices vs date: looks like global events are relevant to my vehicle ownership experience, and I understand why gas prices are a good proxy for what's going on in the world.
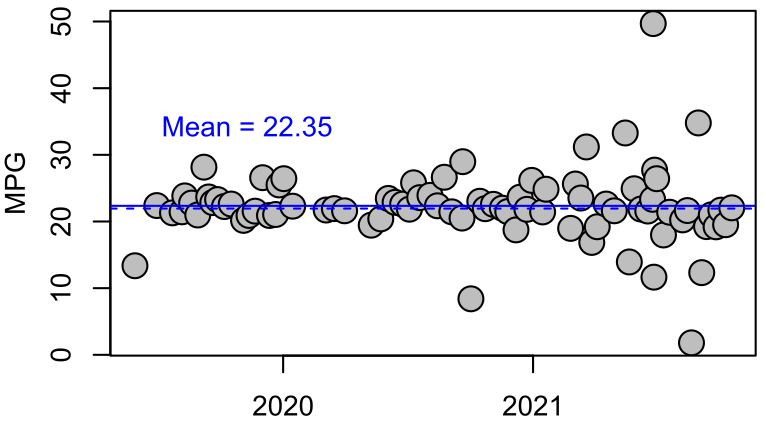
- MPG over time: if you squint your eyes, it's starting to look like my mileage is getting worse. I need to look at this in more detail...
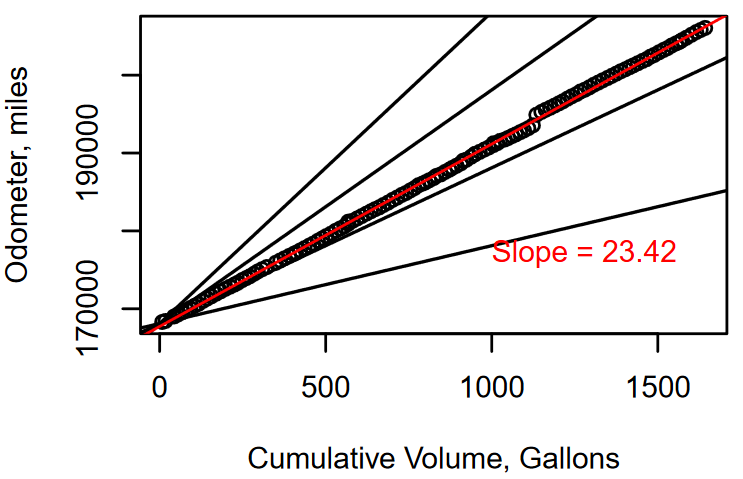
- Cumulative gas usage: Ditto comment above, but this plot is affected by missing data which cause abrupt jumps from one entry to the next. I need to discard this or come up with some kind of a fix for missing data.
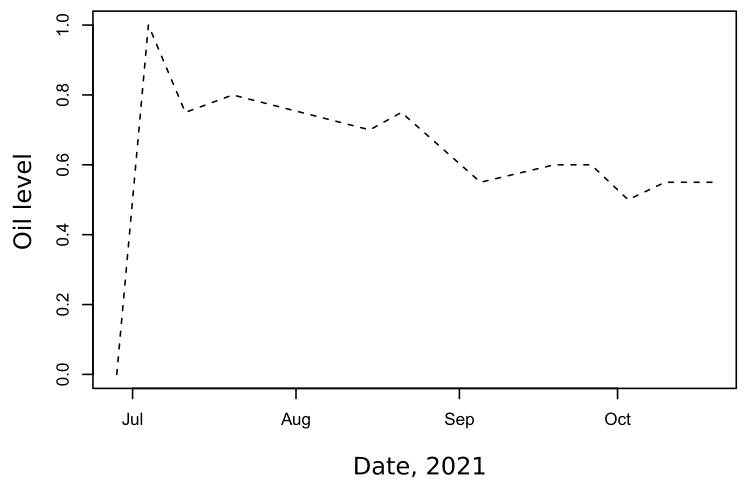
- Oil level: Something happened around Thanksgiving 2023, and my car has been burning more oil after this event. However I'm not sure if this has impacted my fuel economy. It has probably impacted my emissions quality though.
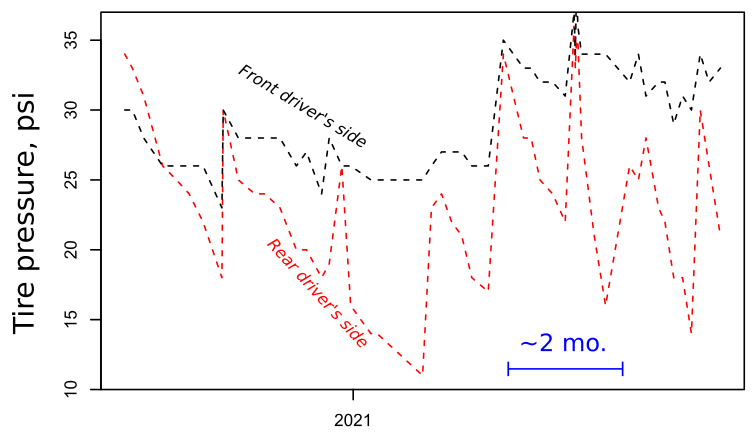
- Tire pressure: After I replaced my tires, I don't need to keep putting air into the rear driver's side tire. Yay!
Noted events from the previous year and before:
- 240501 -- Bad battery. Bought a new one from AutoZone on Roanoke St. in Christiansburg. The cost wat $207.42 for the battery, lube, and taxes, minus a credit for the old battery. It comes with a 2-year warranty from Duralast. My spare battery jumper saved me a couple of times as the battery was failing. Tested badly with my analog battery tester, but I didn't record the result.
- 240411 -- Oil change at Wal-Mart. High-mileage synthetic oil. The total cost including labor was $47.26. ODO = 218789 mi.
- 240108 -- When filling up the oil at the Kroger on University City Bvd., I recorded the oil level at 60%. However I checked the oil when the car was cold after sitting in the parking garage near Derring Hall for about 3 hours, and the level was at about 85%. Probably was worried about burning oil (see comment below).
- 231118 -- Added oil while getting gas near CLT airport. This must have been my Thanksgiving vacation after which I probably started to notice the oil burning and making big smoke clouds.
- 231027 -- When getting gas at Speedway in Blacksburg, I noticed that there were coolant stains/deposits on the top of the plastic coolant reservoir and the fluid level was above the "max" line.
- 230501 -- started experimenting with using higher-octane "plus" fuel (O09)
- 230226 -- Oil level at 100% and oil color light gold after oil change
- 230215 -- When getting gas at Jocomart, I noticed that the tires were overinflated to 40 psi, so I let the air out so they would be 32 psi. It was unseasonably warm that day.
- 230207 -- Tires replaced at Wal-Mart. New tires are Douglas All-Season 94H for $66 each. Including installation fees and labor, the total cost was $357.16. IIRC tires are rated for 40,000 miles. Previous tires were on for about 36,000 miles, so that sounds about right. Tire replacement may have been premature?
- 230205 -- Saw a video on 1A Auto about how tire tread can be estimated using a penny. All tires except rear driver side look like they should be replaced: the tread level doesn't reach the top of Abe Lincoln's head.
- 230205 again -- Standard oil change at Wal-Mart. The total cost was $36.73 with ODO = 206189
- 230117 -- Reading error codes at Advance Auto in Blacksburg. P0330 -> erased. This is for a problem with the #2 knock sensor. I spoke with a random mechanic who refused to work on my car (BS cosmetic things not worth their time), and they said that I don't need to worry about this and should just keep driving. Based on my Haynes manual, it seems like repairing this is a huge pain in the ass and not worth the effort.
Miscellaneous comments from memory:
- The car has started burning oil in a dramatic way. Previously I would need to top off the oil about once every 4-6 months (see previous entries below). I haven't been consistent about recording the times that I have needed to add oil, but they can be inferred from my oil level data. Now it seems like I need to do this about once per month or more frequently. Also, the car has started to put out big clouds of blue smoke, presumably from burning oil. This usually happens when the car is started the next day after traveling a long distance (driving over mountains?) the previous day.
- The air conditioning doesn't work reliably when idle -- this has been the case since last summer.
Rev. 2/12/2023 LRM -- tread penny
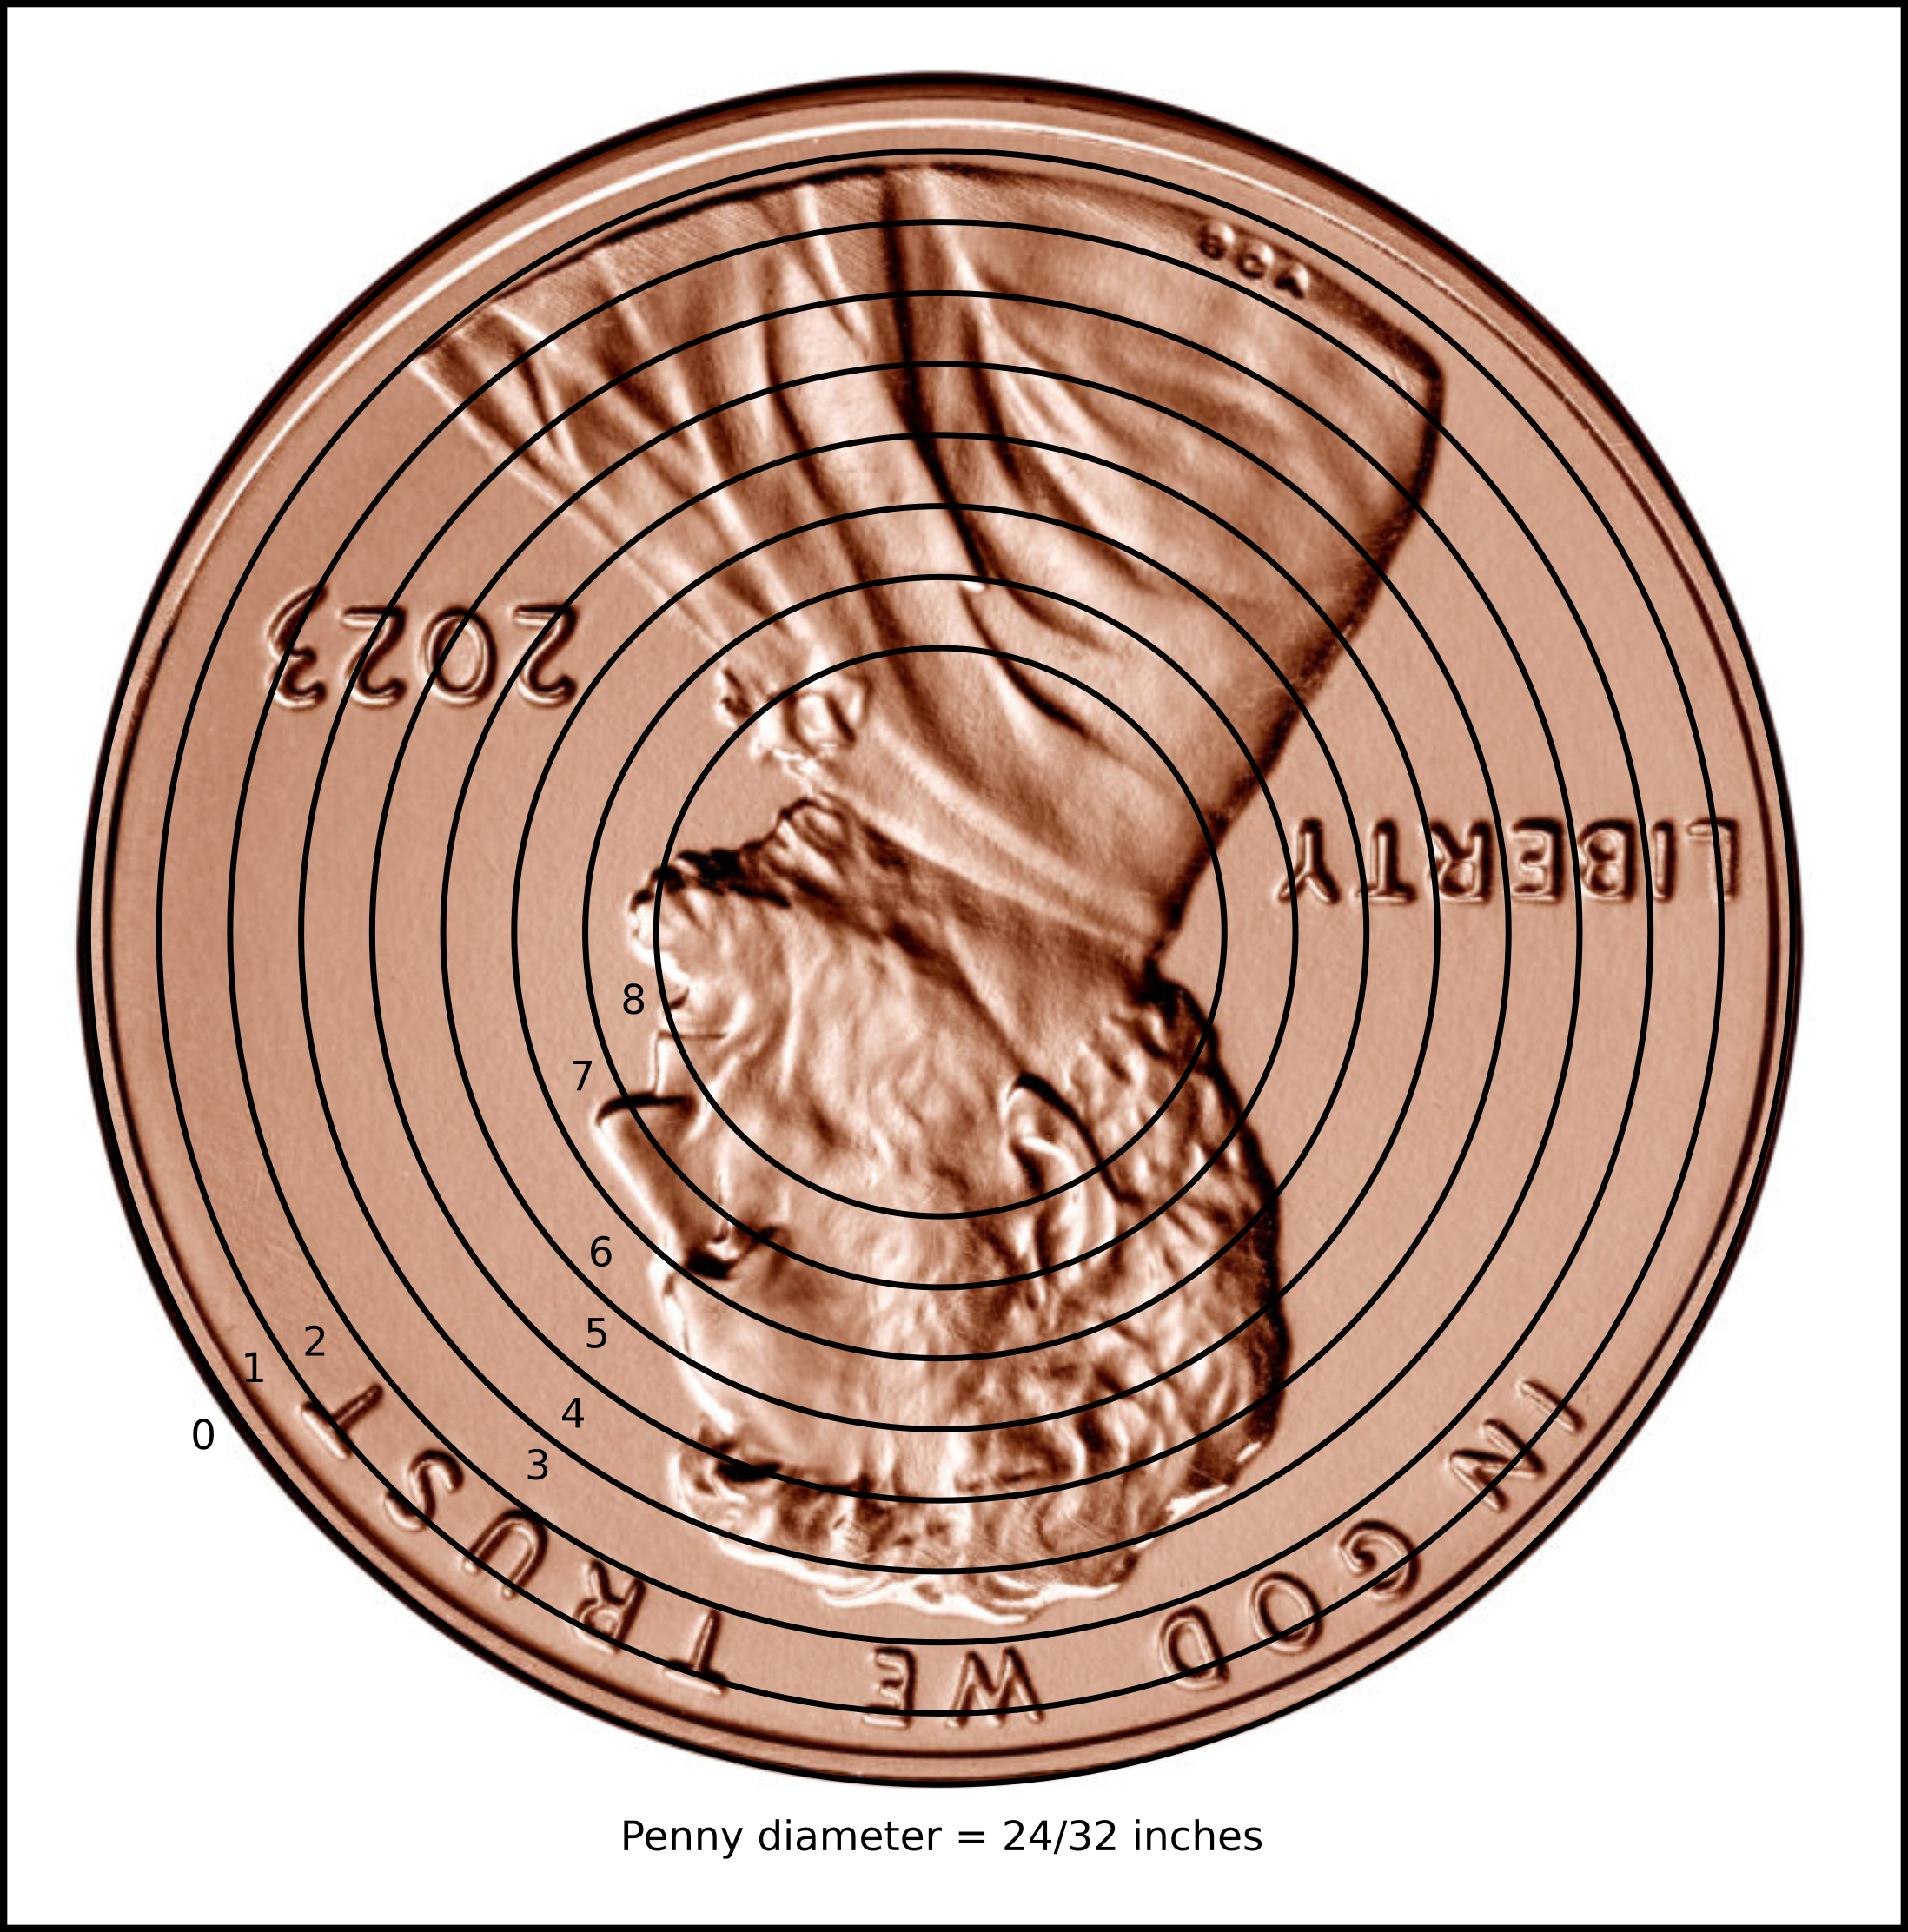
I made this graphic to aid in using a penny to measure tread thickness. A penny has a diameter of 0.75 in, or 24/32 inches. Each circle in the image decreases in diameter by 2/32 inches (or in radius by 1/32 inches). As such, the distance from the edge (or tread thickness) is indicated by the number of 32nds of inches.
Rev. 2/7/2023 LRM -- regular update
It's been almost a year, so it's time for an update. As I wait for my tires to be replaced at Wal-Mart, I've gone ahead and entered another year's worth of data from my notebook into my 98camry repo. Here's a quick summary of things that have happened in the last year, and a few observations from the updated data. Stuff that happened:
- 2/7/2023 -- tires replaced at WalMart. 3/4 of my tires failed the "penny test" with the exception being the RD one that has a slow leak.
- 2/5/2023 -- Standard oil change at WalMart, ODO = 206189. Tail lights flagged as not working, but I think that's because I have a weird third party set of LED lights which probably doesn't match the resistivity the dashboard indicator is made for.
- 1/17/2023 -- Error code P0330 indicates a problem with my knock sensor. I haven't addressed this at the time of writing.
- 7/6/2022 through 8/12/2022 -- Weird engine noise was occurring when I turned on the air conditioner/front defrost. It was diagnosed by an auto shop in Radford to be a bad AC compressor. There was also some faulty wiring and a bad temperature sensor, and trouble getting the temperature sensor made the repair take forever although I was able to drive the car in the interim. Their AC guy was able to "do this thing with a Dremel" (???) which saved a lot on the repair cost but also seems sketchy. I am 100% ok with this!
- 3/5/2022 -- Random entry in my notes reads "Hot out today. ~1 week into Ukraine invasion."
- 7/4/2021 -- More than a year ago, but it's worth noting that this might have been the date of my last previous oil change, at ODO = 189889.
There they are: the pandemic-related oil price crash, and the war-related oil price spike.
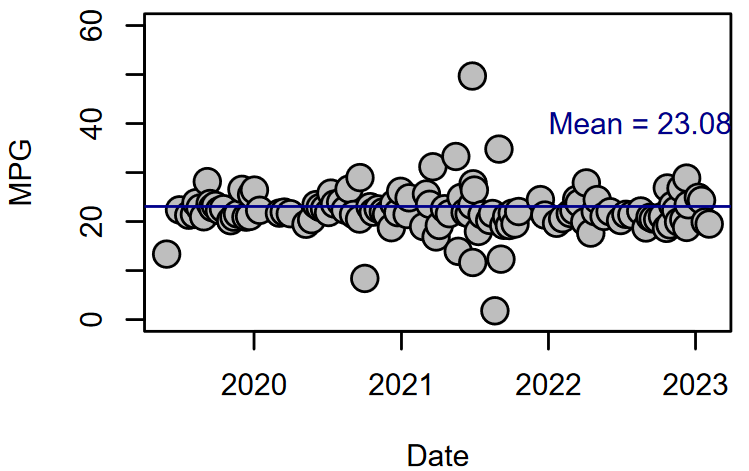
No real change in my mileage. I think some of the high points can be attributed to road trips, which tend to occur in the summer and winter (hard to tell from this plot).
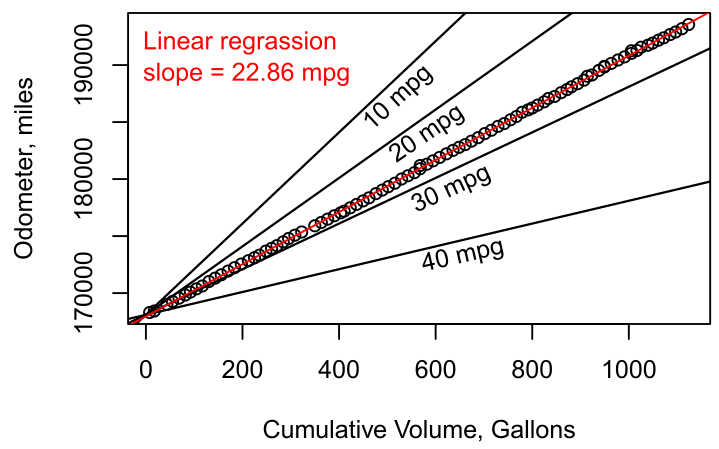
Again, mineage is basically the same. Has my car gotten more efficient?
Rev. 3/7/2022 LRM -- Introduction
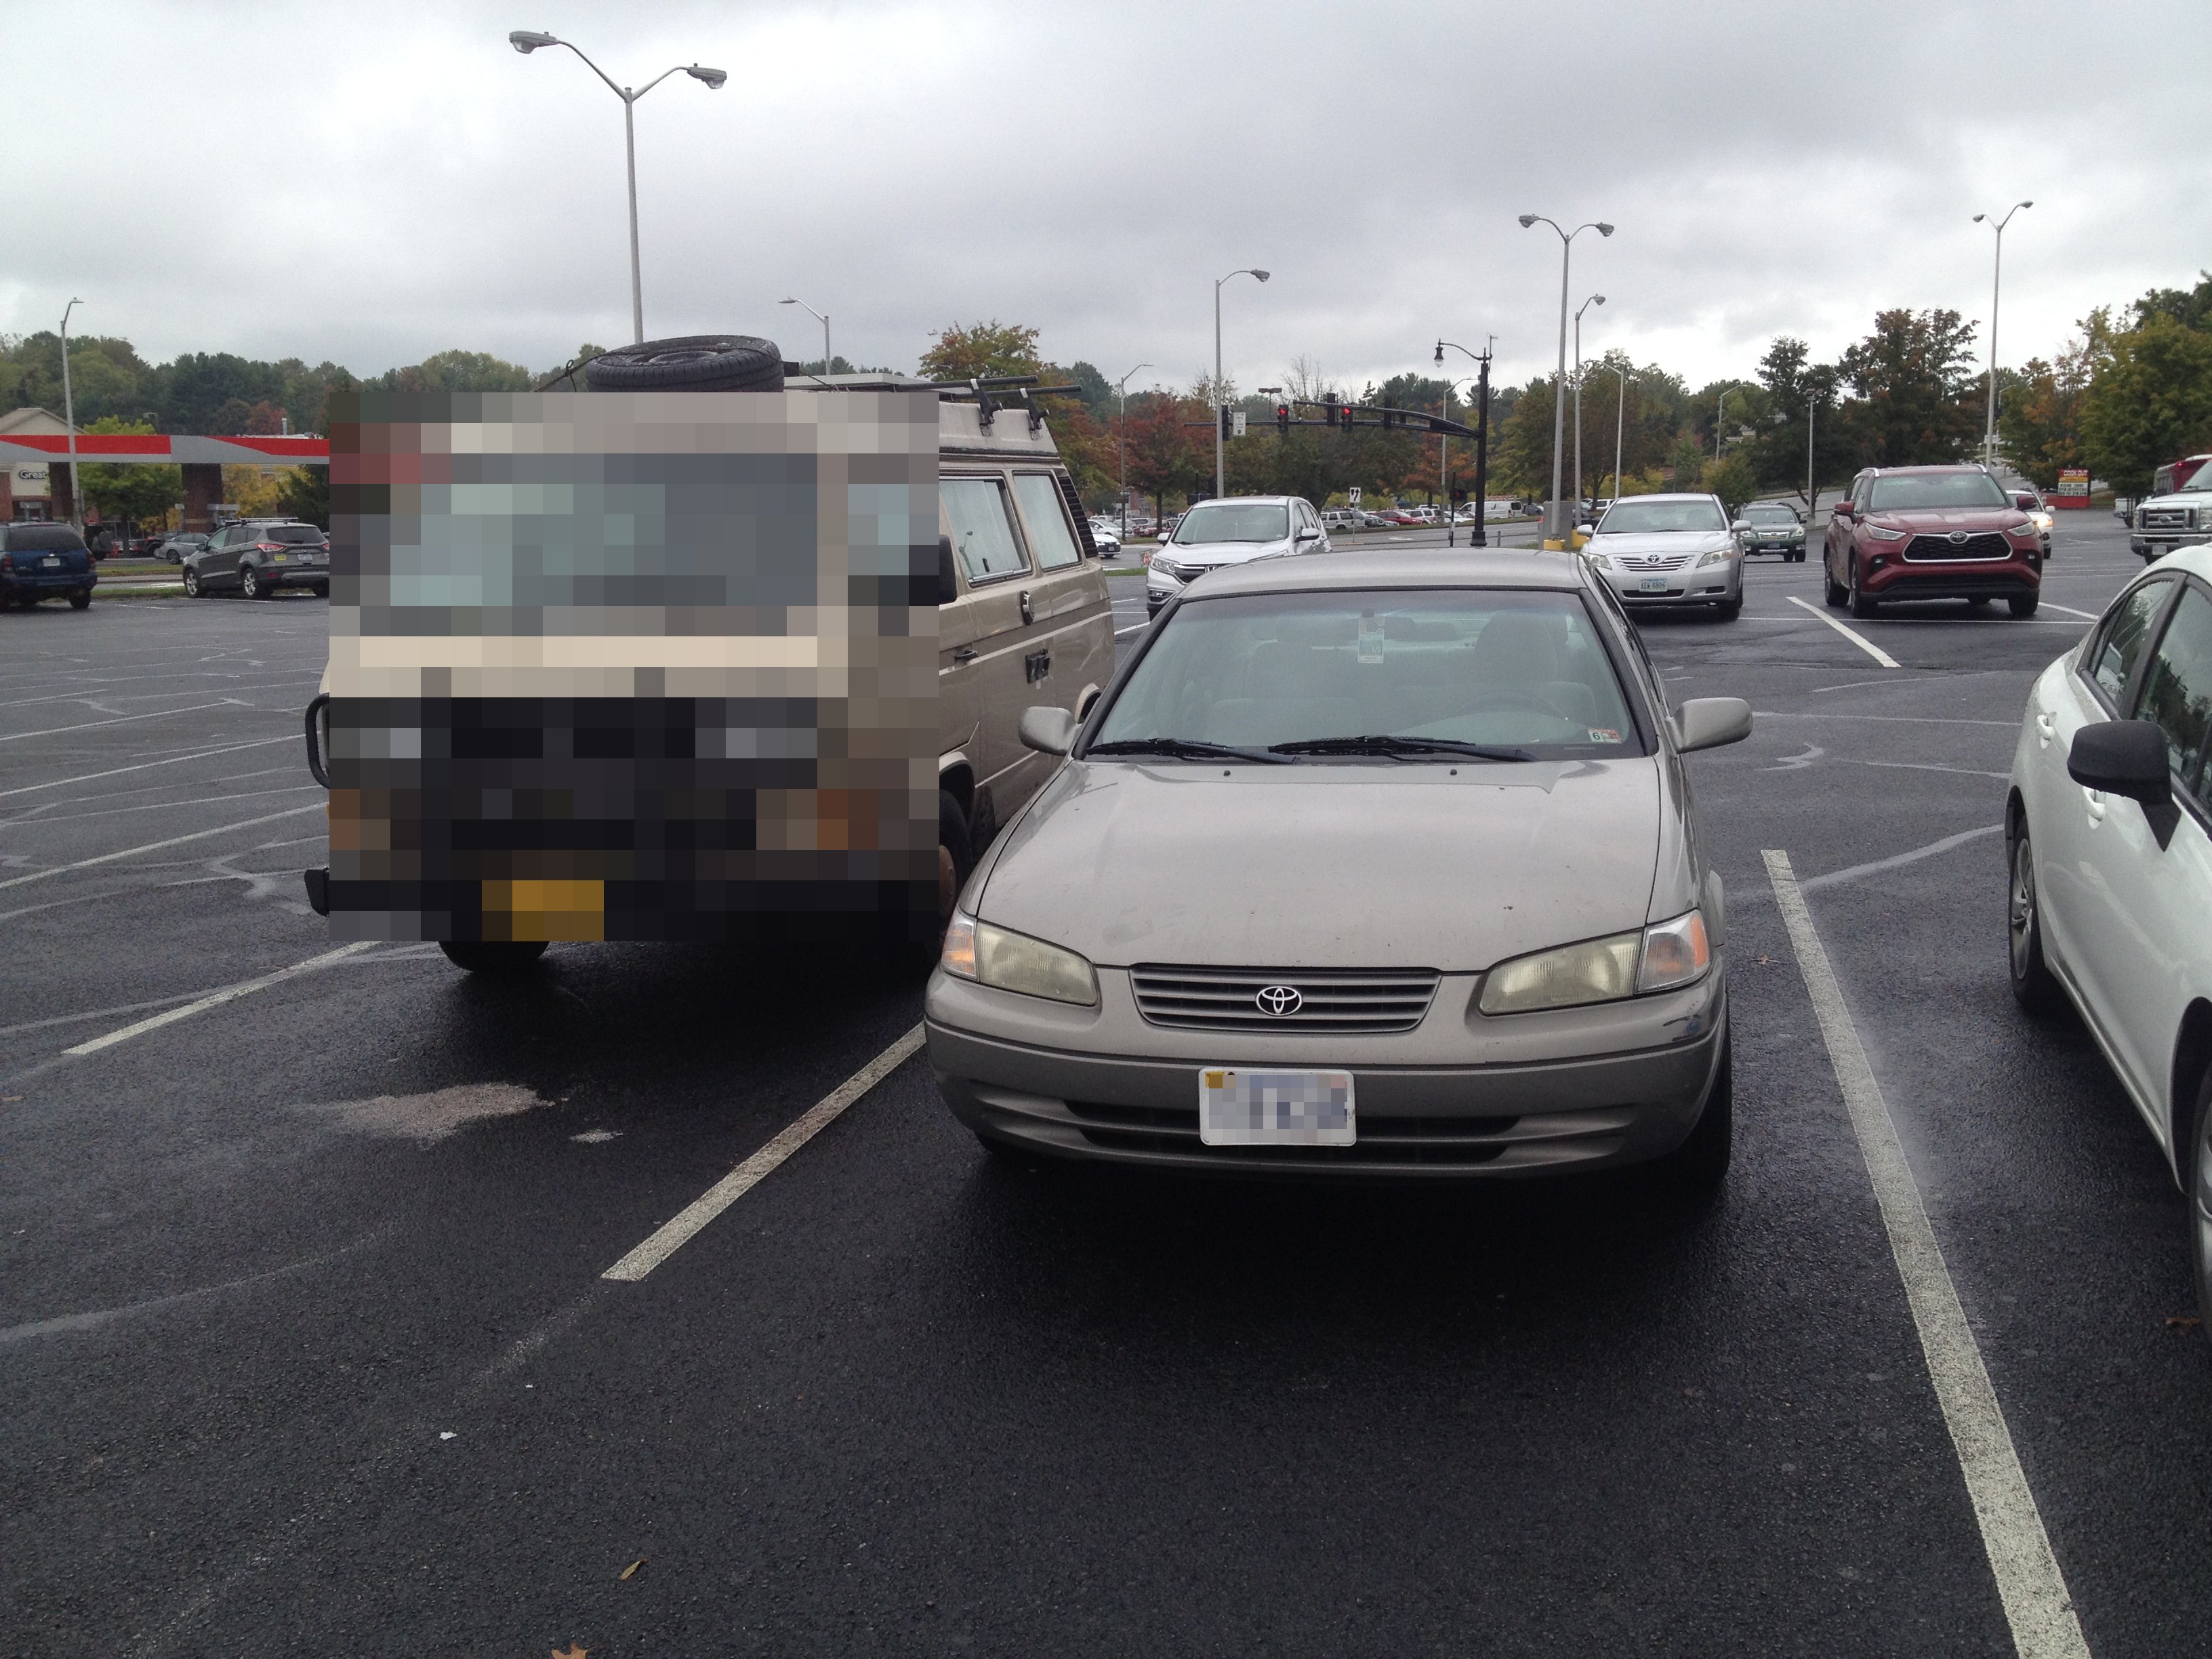
Some time around late 2018 or early 2019, at the age of – well, some time in my late 20’s – I purchased my first car: a 1998 Toyota Camry V6 LE with roughly 170k miles for $1300. The seller was a foreign national who I met through a mutual friend via an email list for international students. Here’s a picture of the car circa 2021:
Since I purchased the car, I have been fastidiously keeping notes on my fuel consumption and maintenance costs in a notebook which lives in the driver’s side door. The format of my notes has wandered a bit over the years, but the data are pretty robust.
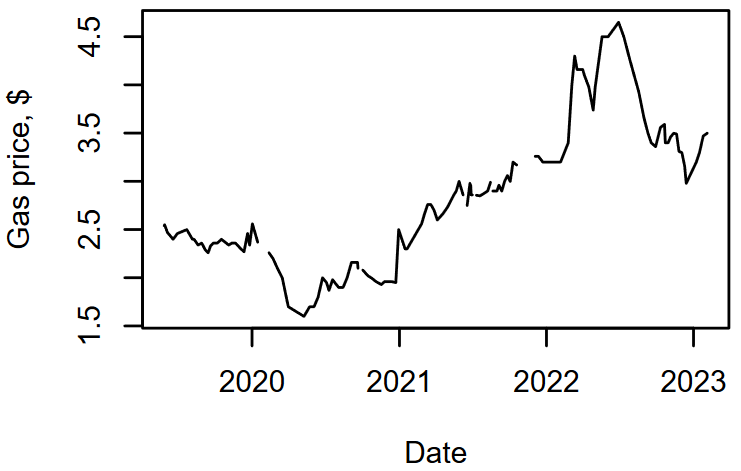
Here are the gas prices I have been subjected to (below). Mostly I refill my tank at the Joco Mart (Exxon) near the on-ramp to Rte. 460 in northern Christiansburg, but some of my notes are from road trips as far south as Atlanta and as far north as Syracuse, NY. Generally the geographic variability is negligible compared to the wander in gas prices over time.
Since I purchased the car, I have driven roughly 25,000 miles and consumed around 1,200 gallons of regular unleaded gas – that’s probably somewhat larger than the volume of the car itself. That means I’m getting about 20 mpg, which is about right for my car according to fueleconomy.gov. Not great; not terrible! Here is a plot of the cumulative gas consumption vs odometer reading.
Assuming that I always fill my tank to full (probably a fair assumption), I can calculate my mileage after any given trip to the gas station. Here is my fuel consumption rate (mpg) over time (below). What are the outliers? Does it look like my car is losing efficiency? Only time will tell! My mechanic says I don’t need to worry until the efficiency drops to around 18 mpg or so...
The horizontal lines in the plot above are from the following histogram of my calculated mileage for each trip to the gas station:
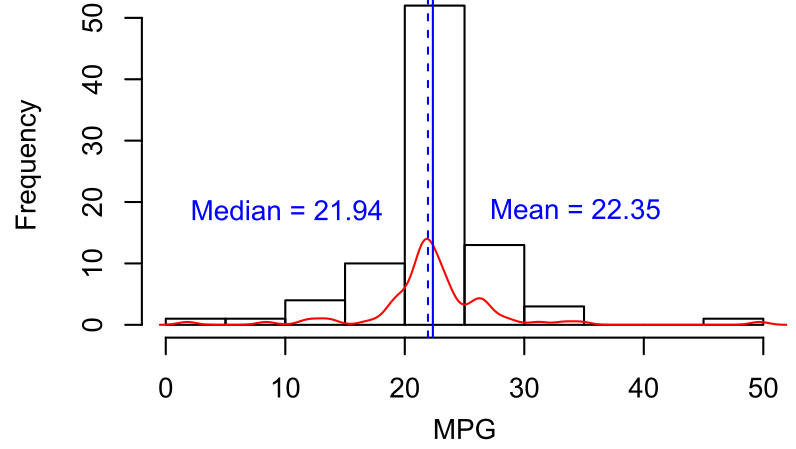
Recently I have noticed that my engine is burning oil, so I have been trying to “eyeball” the oil level on my dipstick during each visit to the gas station. Here is a plot of some of the data from late 2021 (below), where 0 and 1 correspond to the low and high markings on the dipstick respectively. It looks like I’ll be topping the oil off once every 4 to 6 months.
In early 2020, I started tracking my tire pressure using an analogue pressure gauge. It appears that one of my tires is leaking air faster than the others. The plot below shows tire pressure (psi) over time. The black line is the average pressure of my three good tires, and the red line shows the pressure of my rear driver’s side tire. The x-axis of the plot is poorly labeled, but I have been refilling my tires about once every two months.
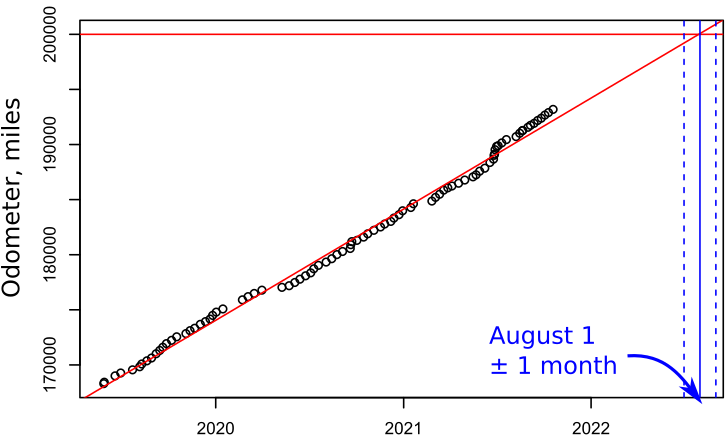
Finally, I am curious about about when my car will go over 200k miles. In lieu of a rigorous linear model with a calculated uncertainty envelope, I have “eyeballed” the date using a line drawn with the lm() function in R until I can get the predict() function to work with the Date-formatted column in my data. It looks like the odometer will go over 200k around August 1 plus or minus a month or so (shown by the dashed vertical lines below).
Here’s the Github repository I have been updating periodically: https://github.com/moorelr/98camry